Creating a multi-stage YAML pipeline in Azure DevOps for .NET projects
Running tests with code coverage in Azure DevOps YAML pipelines
Static code analysis with NDepend in Azure Pipelines
Running e2e tests with Playwright in Azure YAML Pipelines
Publishing Playwright report as an artifact in Azure DevOps
Bicep Infrastructure Deployment from Azure DevOps YAML Pipelines
Blue-green Deployments in Azure DevOps YAML Pipelines
Pre-Deployment Health Checks in Azure DevOps YAML Pipelines
Azure DevOps Best Practices: Breaking Down the Monolithic YAML
In the previous article we saw how to create a basic multi-stage YAML pipeline. In this one we're going to see how to run unit tests and also see their code coverage.
Adding stage for running unit tests
Before starting with this blog post I will assume that you already have a unit test project in your solution. If you haven't done that, then you can watch the full video with all these steps in my YouTube channel. Now we can proceed!
Open your azure-pipelines.yml file and add this stage between the build and the deployment stages.
- stage: test
  jobs:
    - job: test
      steps:
      - task: DotNetCoreCLI@2
        inputs:
          command: 'test'
          projects: '**/*[Tt]est*/*.csproj'
          publishTestResults: true
          arguments: '--configuration $(buildConfiguration) /p:CollectCoverage=true /p:CoverletOutputFormat=cobertura'
This stage has a task which runs the unit tests for all the projects that follow this naming convention: '**/[Tt]est/*.csproj'. This means that if your csproj has "test" or "Test" in the name, it will be ran by this task. You can now save and run the pipeline.
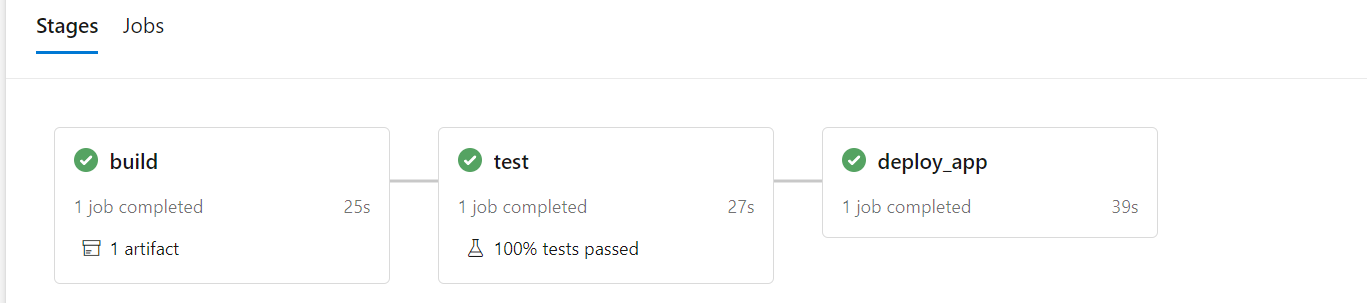
Your pipeline should now contain 3 stages, the initial "build" and "deploy" stages plus the "test" stage we just added.
Setting up code coverage
The first thing we have to do is to install a Nuget package called "coverlet.msbuild" inside our unit tests project. Once you did this and pushed the changes to your repository it's time to change the pipeline.
In the previous step we created a task for running unit tests and at the end we added some arguments. Those are used to calculate the code coverage, but we also need to publish it in order to view it in our pipeline run. To do this you need to open the pipeline in edit mode and add this task:
- task: PublishPipelineArtifact@1
   inputs:
     targetPath: $(build.artifactStagingDirectory)
     artifact: 'drop'
     publishLocation: 'pipeline'
Hit save and run the pipeline, that's it! The full YAML file can be found in this gist.
Viewing results
Now when you look at the output of the task which runs unit tests you will also see this part:
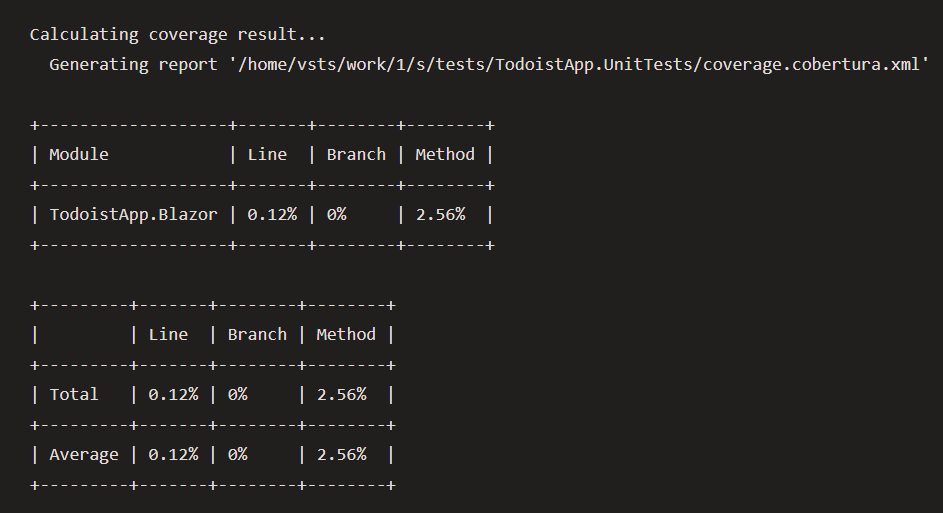
This means that our code coverage is working and we can see information like "Line coverage", "Branch coverage" and "Method coverage".
Another place we can see all this information is in the pipeline run.
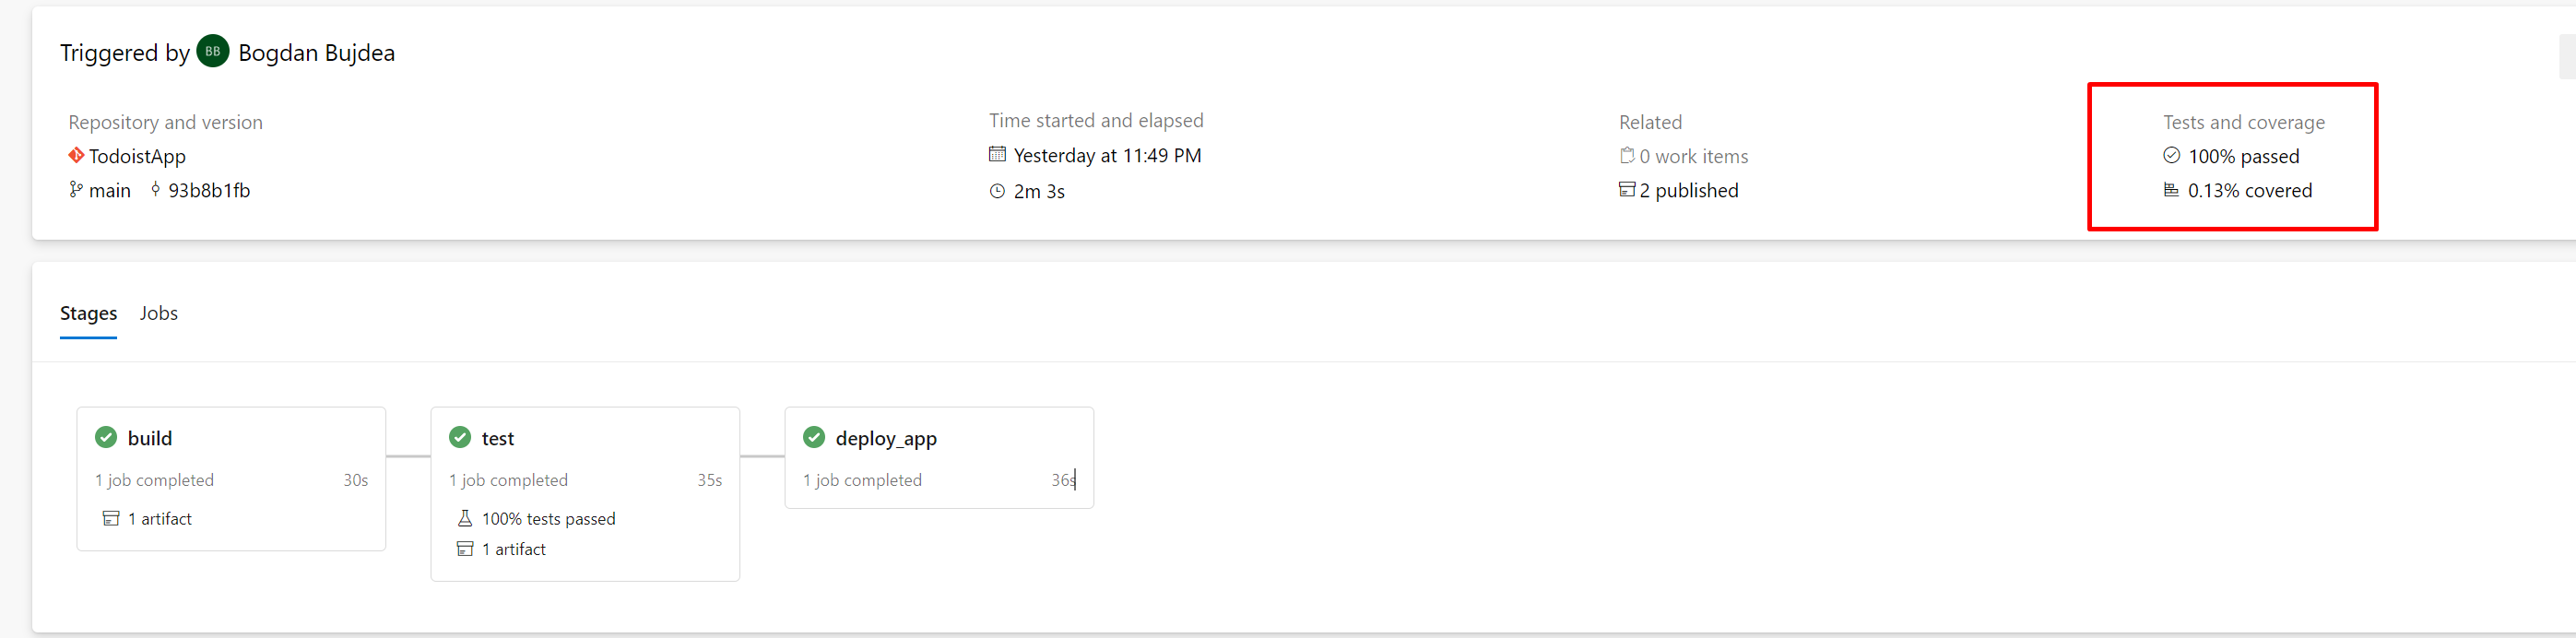
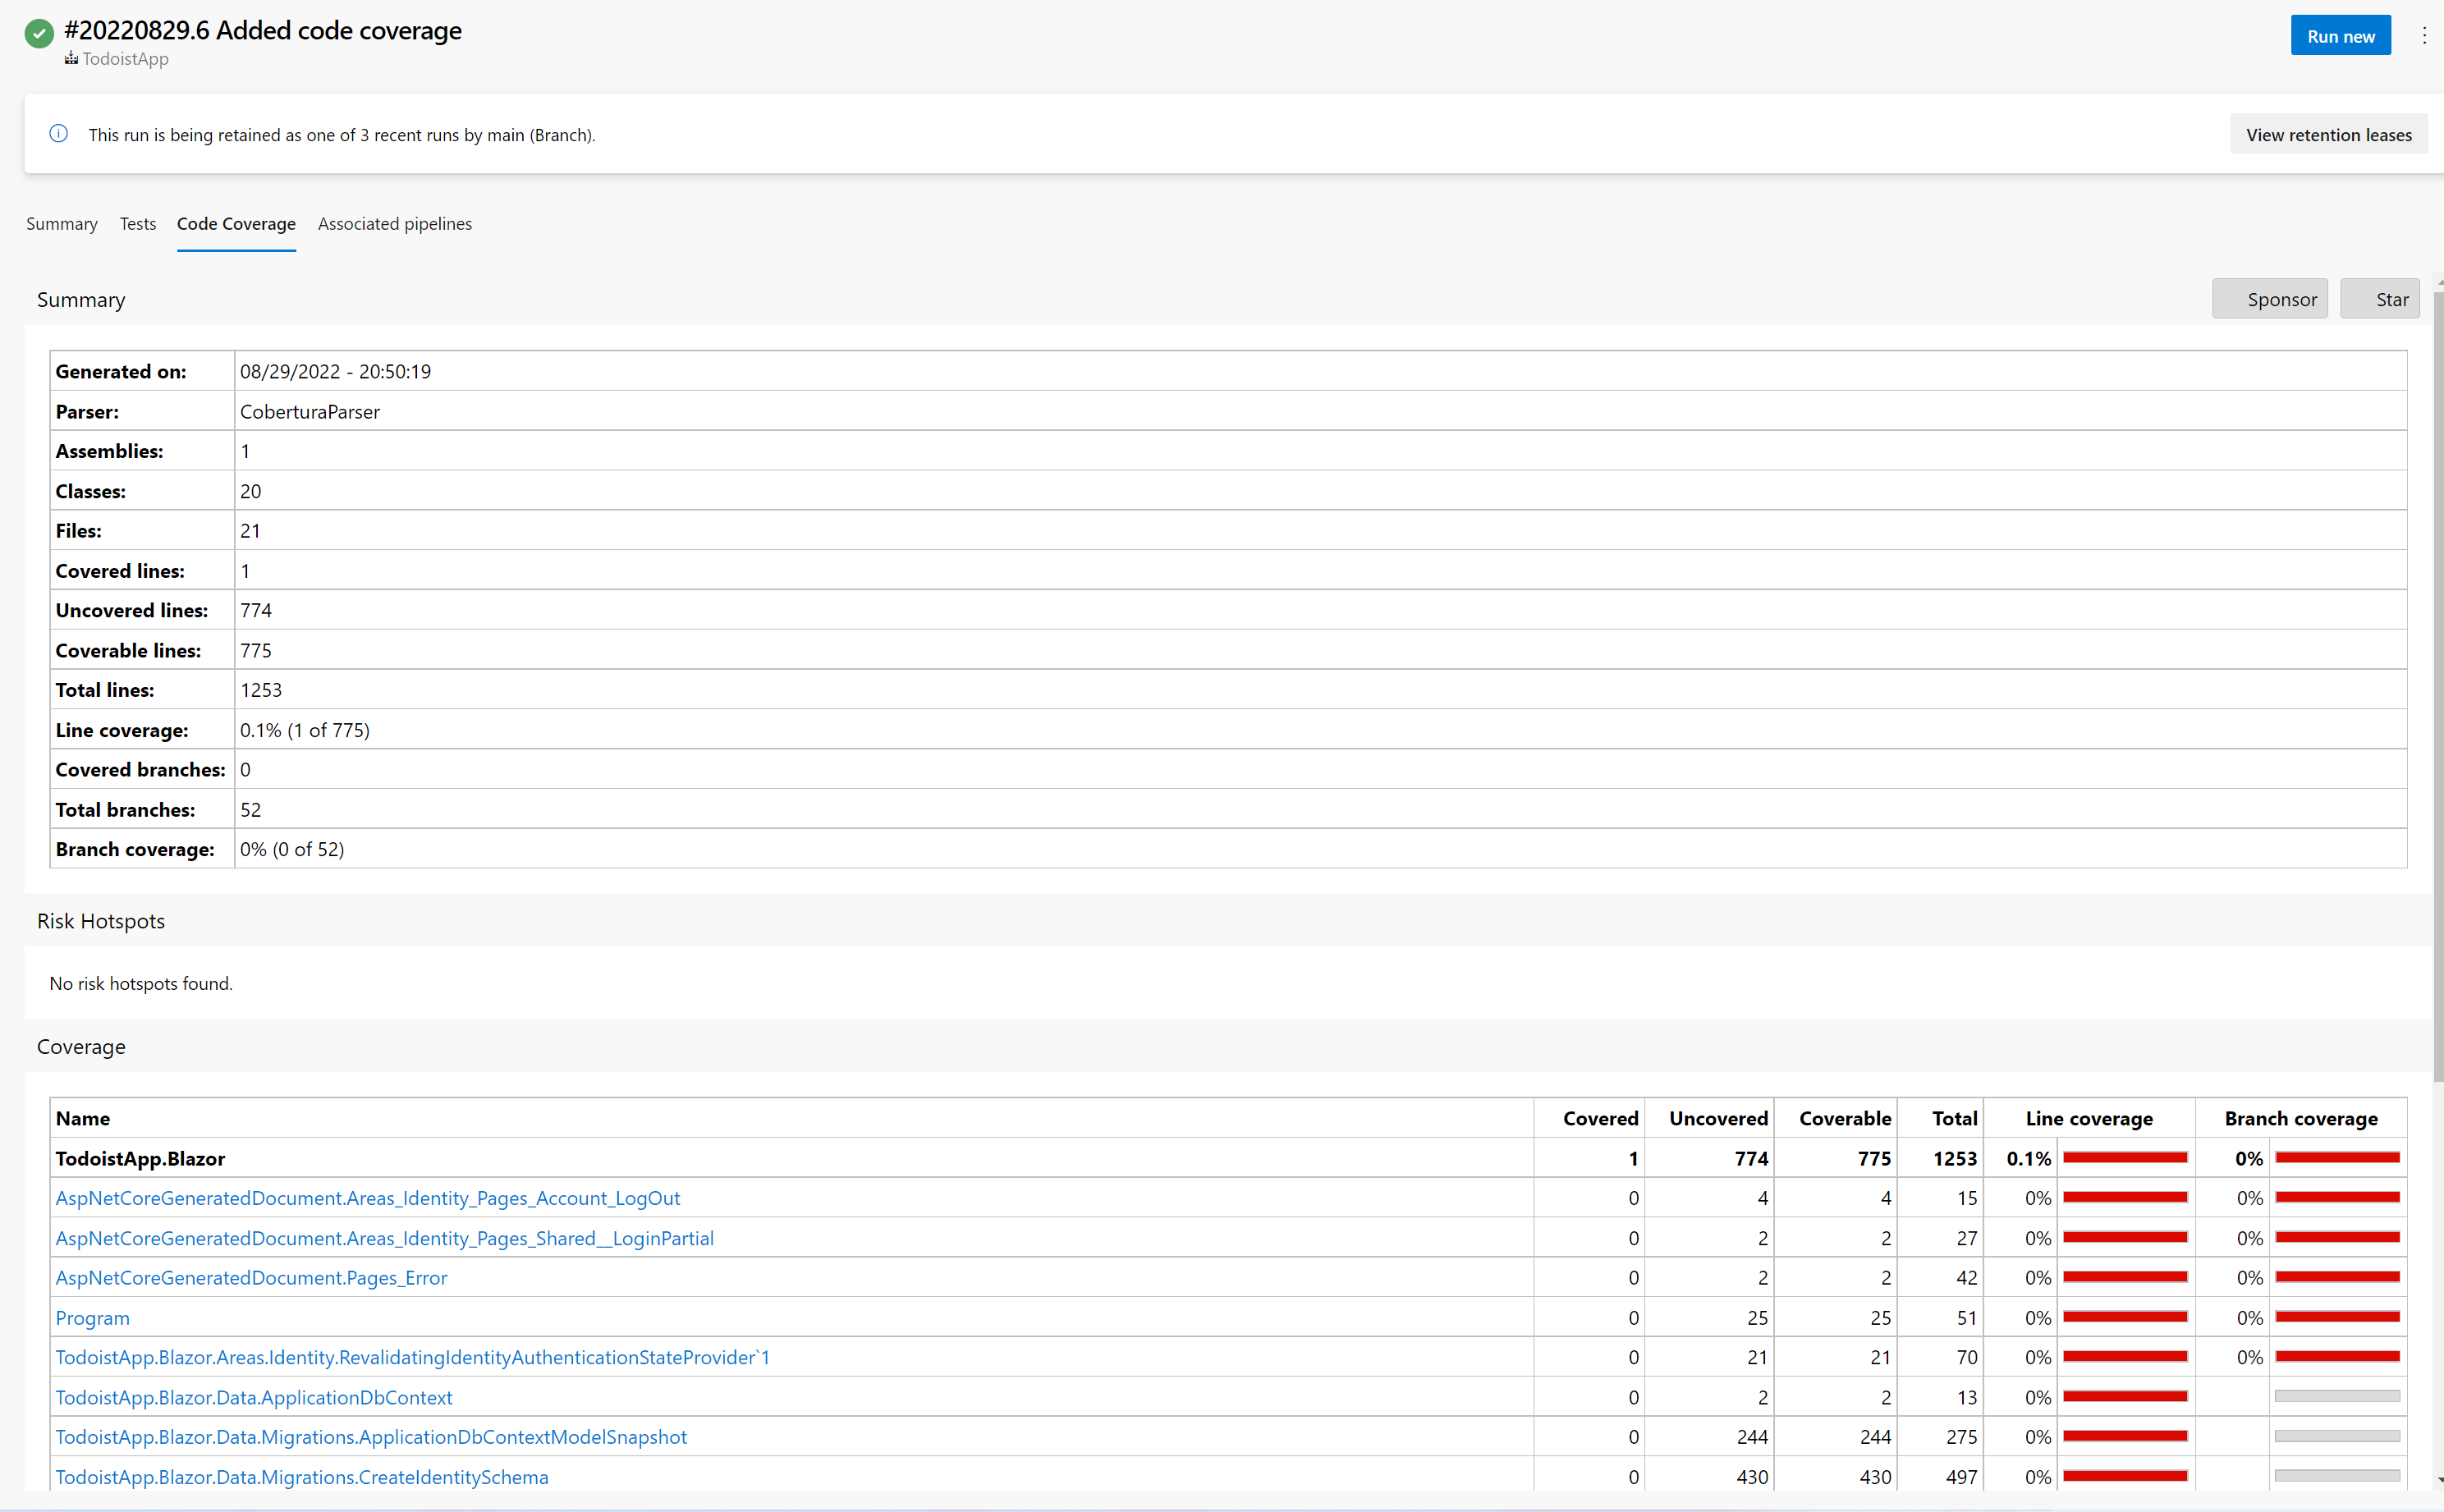
If you click on the link with the coverage (where it says "0.13% covered") it will take you to this HTML file where you can see detailed information about the results.
I'll try to make a detailed video/article in the future where I'll show you how to make different types of HTML reports and how to analyze the progress of the code coverage results for each run. For example, you can see if the code coverage is increasing or not over time and you can even make rules which block a PR if the code coverage is decreasing.
For now I want to continue with static code analysis so if you want to be notified when it's posted you can subscribe to this blog's newsletter or follow me on Twitter!