Pre-Deployment Health Checks in Azure DevOps YAML Pipelines
Boosting Deployment Confidence with Comprehensive Health Checks
Expert generalist • Independent Contractor • Microsoft MVP • Home Assistant enthusiast Hi there! I'm Bogdan Bujdea, a software developer from Romania. I'm currently a .NET independent contractor, and in my free time I get involved in the local .NET community or I'm co-organizing the @dotnetdays conference. I consider myself an expert generalist, mostly because I enjoy trying out new stuff whenever I get the chance and I get bored pretty easily, so on this blog you'll see me posting content from programming tutorials to playing with my smart gadgets.
Creating a multi-stage YAML pipeline in Azure DevOps for .NET projects
Running tests with code coverage in Azure DevOps YAML pipelines
Bicep Infrastructure Deployment from Azure DevOps YAML Pipelines
Azure DevOps Best Practices: Breaking Down the Monolithic YAML
In our last article, we explored the slot-swapping technique in Azure Pipelines. While swapping provides us with seamless deployments, how do we ensure that the newly deployed code in the staging slot is healthy and ready for production? The answer: Health Checks. This article uncovers the importance and implementation of health checks in .NET applications, ensuring that we can confidently swap our slots without unexpected hiccups.
Why Health Checks?
Imagine deploying a new release to your staging environment. You swap the slots, and suddenly, users are facing issues. You'd wish there were a mechanism to catch these glitches before the switch. That's where health checks come in.
At its core, health checks provide an automated way to verify if your application is functioning correctly after a new deployment. They can test various parts of your system and ensure that they're not just alive but well.
Creating a custom Health Check
Before diving deep, let's start with a simple custom health check in a .NET application. This check will randomly return a health status:
public class ToDoAppHealthCheck : IHealthCheck
{
    public Task<HealthCheckResult> CheckHealthAsync(HealthCheckContext context, CancellationToken cancellationToken = new CancellationToken())
    {
        try
        {
            var todoService = new ToDoService();
            if (todoService.IsUpAndRunning())
            {
                return Task.FromResult(HealthCheckResult.Healthy("The ToDO service is up and running"));
            }

            return Task.FromResult(HealthCheckResult.Degraded("The ToDo service has issues"));
        }
        catch (Exception e)
        {
            return Task.FromResult(HealthCheckResult.Unhealthy("The ToDo service is having issues", e));
        }
    }
}
...
// this is the method from the ToDoService which sends a random status
public bool IsUpAndRunning()
        {
            var status = DateTime.UtcNow.Millisecond % 3;
            switch (status)
            {
                case 0:
                    return true;
                case 1:
                    return false;
                default:
                    throw new Exception("Service is down");
            }
        }
This is not a practical health check but serves as a simple example to get us started.
To enable health checks in our app we have to add these lines to Program.cs:
builder.Services.AddHealthChecks()
    .AddCheck<ToDoAppHealthCheck>("ToDoApp");
...
app.MapHealthChecks("/health");
If you start your app and go to the /health endpoint you'll notice that the response is a string with one the following values: "Healthy", "Degraded" and "Unhealthy". This is fine but I like more details so I'm sending a JSON instead, and for this you need to add a parameter to the MapHealthChecks function like this:
app.MapHealthChecks("/health", new HealthCheckOptions
{
    ResponseWriter = async (context, report) =>
    {
        var result = new
        {
            status = report.Status.ToString(),
            entries = report.Entries.Select(e => new
            {
                key = e.Key,
                status = e.Value.Status.ToString(),
                description = e.Value.Description,
                duration = e.Value.Duration,
                exception = e.Value.Exception?.Message
            })
        };

        await context.Response.WriteAsJsonAsync(result);
    }
});
Now the response will look like this:
{
    "status": "Unhealthy",
    "entries": [
        {
            "key": "ToDoApp",
            "status": "Unhealthy",
            "description": "The ToDo service is having issues",
            "duration": "00:00:00.0002569",
            "exception": "Service is down"
        }
    ]
}
Azure Pipeline: Triggering Health Check
For our Azure Pipeline, we'll implement a YAML step that runs a PowerShell script. This script will make a web request to the /health endpoint and verify the application's health status.
This is the YAML code for calling the script:
- task: AzureCLI@2
  retryCountOnTaskFailure: 3
  displayName: 'Check App health before swapping slots'
  inputs:
    azureSubscription: 'AzureConnection'
    scriptType: 'pscore'
    scriptLocation: 'scriptPath'
    scriptPath: './infrastructure/healthcheck.ps1'
    arguments: '$(stagingAppUrl)'
This task will invoke the script below and it will retry a maximum of 3 times. If the script fails 4 times then the pipeline won't proceed and our staging slot won't be swapped with the production one.
param (
    $stagingApiUrl
)
Start-Sleep -Seconds 5

Write-Host "Health check for $stagingApiUrl"

$response = Invoke-WebRequest -Uri $stagingApiUrl -UseBasicParsing -ErrorAction SilentlyContinue
if ($null -eq $response) {
    $statusCode = $Error[0].Exception.Response.StatusCode.Value__
    $reader = New-Object System.IO.StreamReader($Error[0].Exception.Response.GetResponseStream())
    $content = $reader.ReadToEnd() | ConvertFrom-Json
} else {
    $statusCode = $response.StatusCode
    $content = $response.Content | ConvertFrom-Json
}

if ($statusCode -eq 200 -and $content.status -eq "Healthy") {
    Write-Host $response.Content
} else {
    Write-Host "API health check failed with status code: $statusCode and health status: $($content.status)"
    exit 1
}
This script could have been much shorter, but it isn't too complicated. Let me explain what it does.
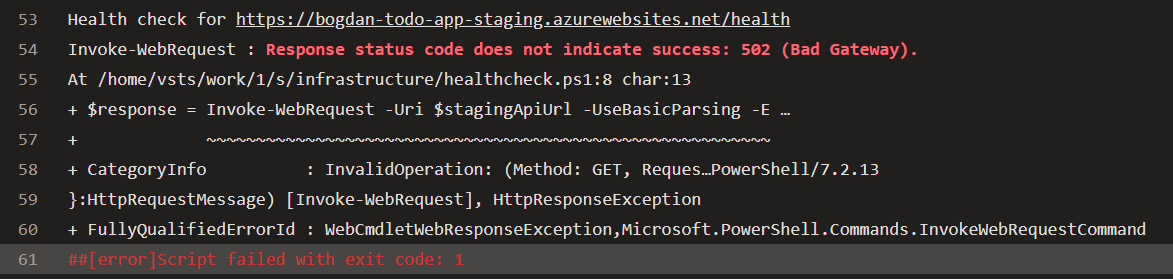
First, the script waits for 5 seconds at startup. This is because just prior to this task, we deployed our code to the staging slot, and it might take some time for the staging slot to be ready to serve requests. Until that occurs, the app will return a 502 error, so we need to account for this. The time it takes to be ready can vary depending on the tier of your app service and what you have deployed. For instance, if you're running migrations at startup, the code is deployed, but the app won't serve requests until the migrations have been applied. As a result, it will return a 502 error for every request until the process is complete, like this:
After the 5-second interval, the script sends a request to our staging slot's /health endpoint, which in our case is https://bogdan-todo-app-staging.azurewebsites.net/health.
We then obtain the status and content of the response. To proceed with the swap, we need the status code to be 200 and the health check status to be Healthy. Of course, this can be adjusted; perhaps you are comfortable with a Degraded status as well. However, it's up to you to decide.
The /health endpoint will return a JSON that looks like this:
{
    "status": "Unhealthy",
    "entries": [
        {
            "key": "ToDoApp",
            "status": "Unhealthy",
            "description": "The ToDo service is having issues",
            "duration": "00:00:00.0002569",
            "exception": "Service is down"
        },
        {
            "key": "ExternalAPI",
            "status": "Healthy",
            "description": null,
            "duration": "00:00:00.0000015",
            "exception": null
        }
    ]
}
There's an overall status and then each health check has its own status. That's why it's up to you whether you want to check only the overall status or focus on specific services. For instance, I might have a health check for Google Analytics that I can ignore because it's not critical for my app, but I really need the Stripe API to be up and running, so I'll base my decision on that.
Health checks in real-world applications
The example provided earlier serves as a basic introduction. Now, let's delve into the practical application of health checks in robust, real-world scenarios. In my ongoing project, I employ a combination of custom and predefined health checks. For instance, I've developed a custom health check for an external API. Despite having unit and integration tests for this API, they don't directly interact with it. Directly calling an external API from unit tests isn't justifiable. While our integration tests are responsible for contract testing, they don't communicate with the external API either. Instead, we ensure that the sent data adheres to the correct format and the expected response is received. But this doesn't guarantee full-proof coverage, and that's where the importance of health checks is underscored.
Imagine a scenario where a newly committed change unintentionally introduces a bug—say, it's related to retrieving API credentials from an Azure Key Vault. This glitch may remain unnoticed until deployment. Fortunately, our health checks are designed to flag such issues prior to the staging slot being swapped with production.
Configuring health check monitoring in Azure
Azure App Services offers the flexibility to consistently monitor the /health endpoint. This monitoring can be set at specific intervals, coupled with the provision to set up alerts for anomalies. Consider a situation where post-deployment, someone modifies the credentials in the Key Vault. In such instances, an immediate alert can assist in swift remediation. Similarly, if the external API faces downtime due to reasons beyond your control, it's beneficial to be aware. This not only aids in timely communication with stakeholders but also reassures them of your system's integrity.
This is how you configure health check monitoring in Azure:
Open the app service in Azure and go to Monitoring -> Health check

Select Enable and provide a valid URL path, in our case it's
/healthSelect Save.
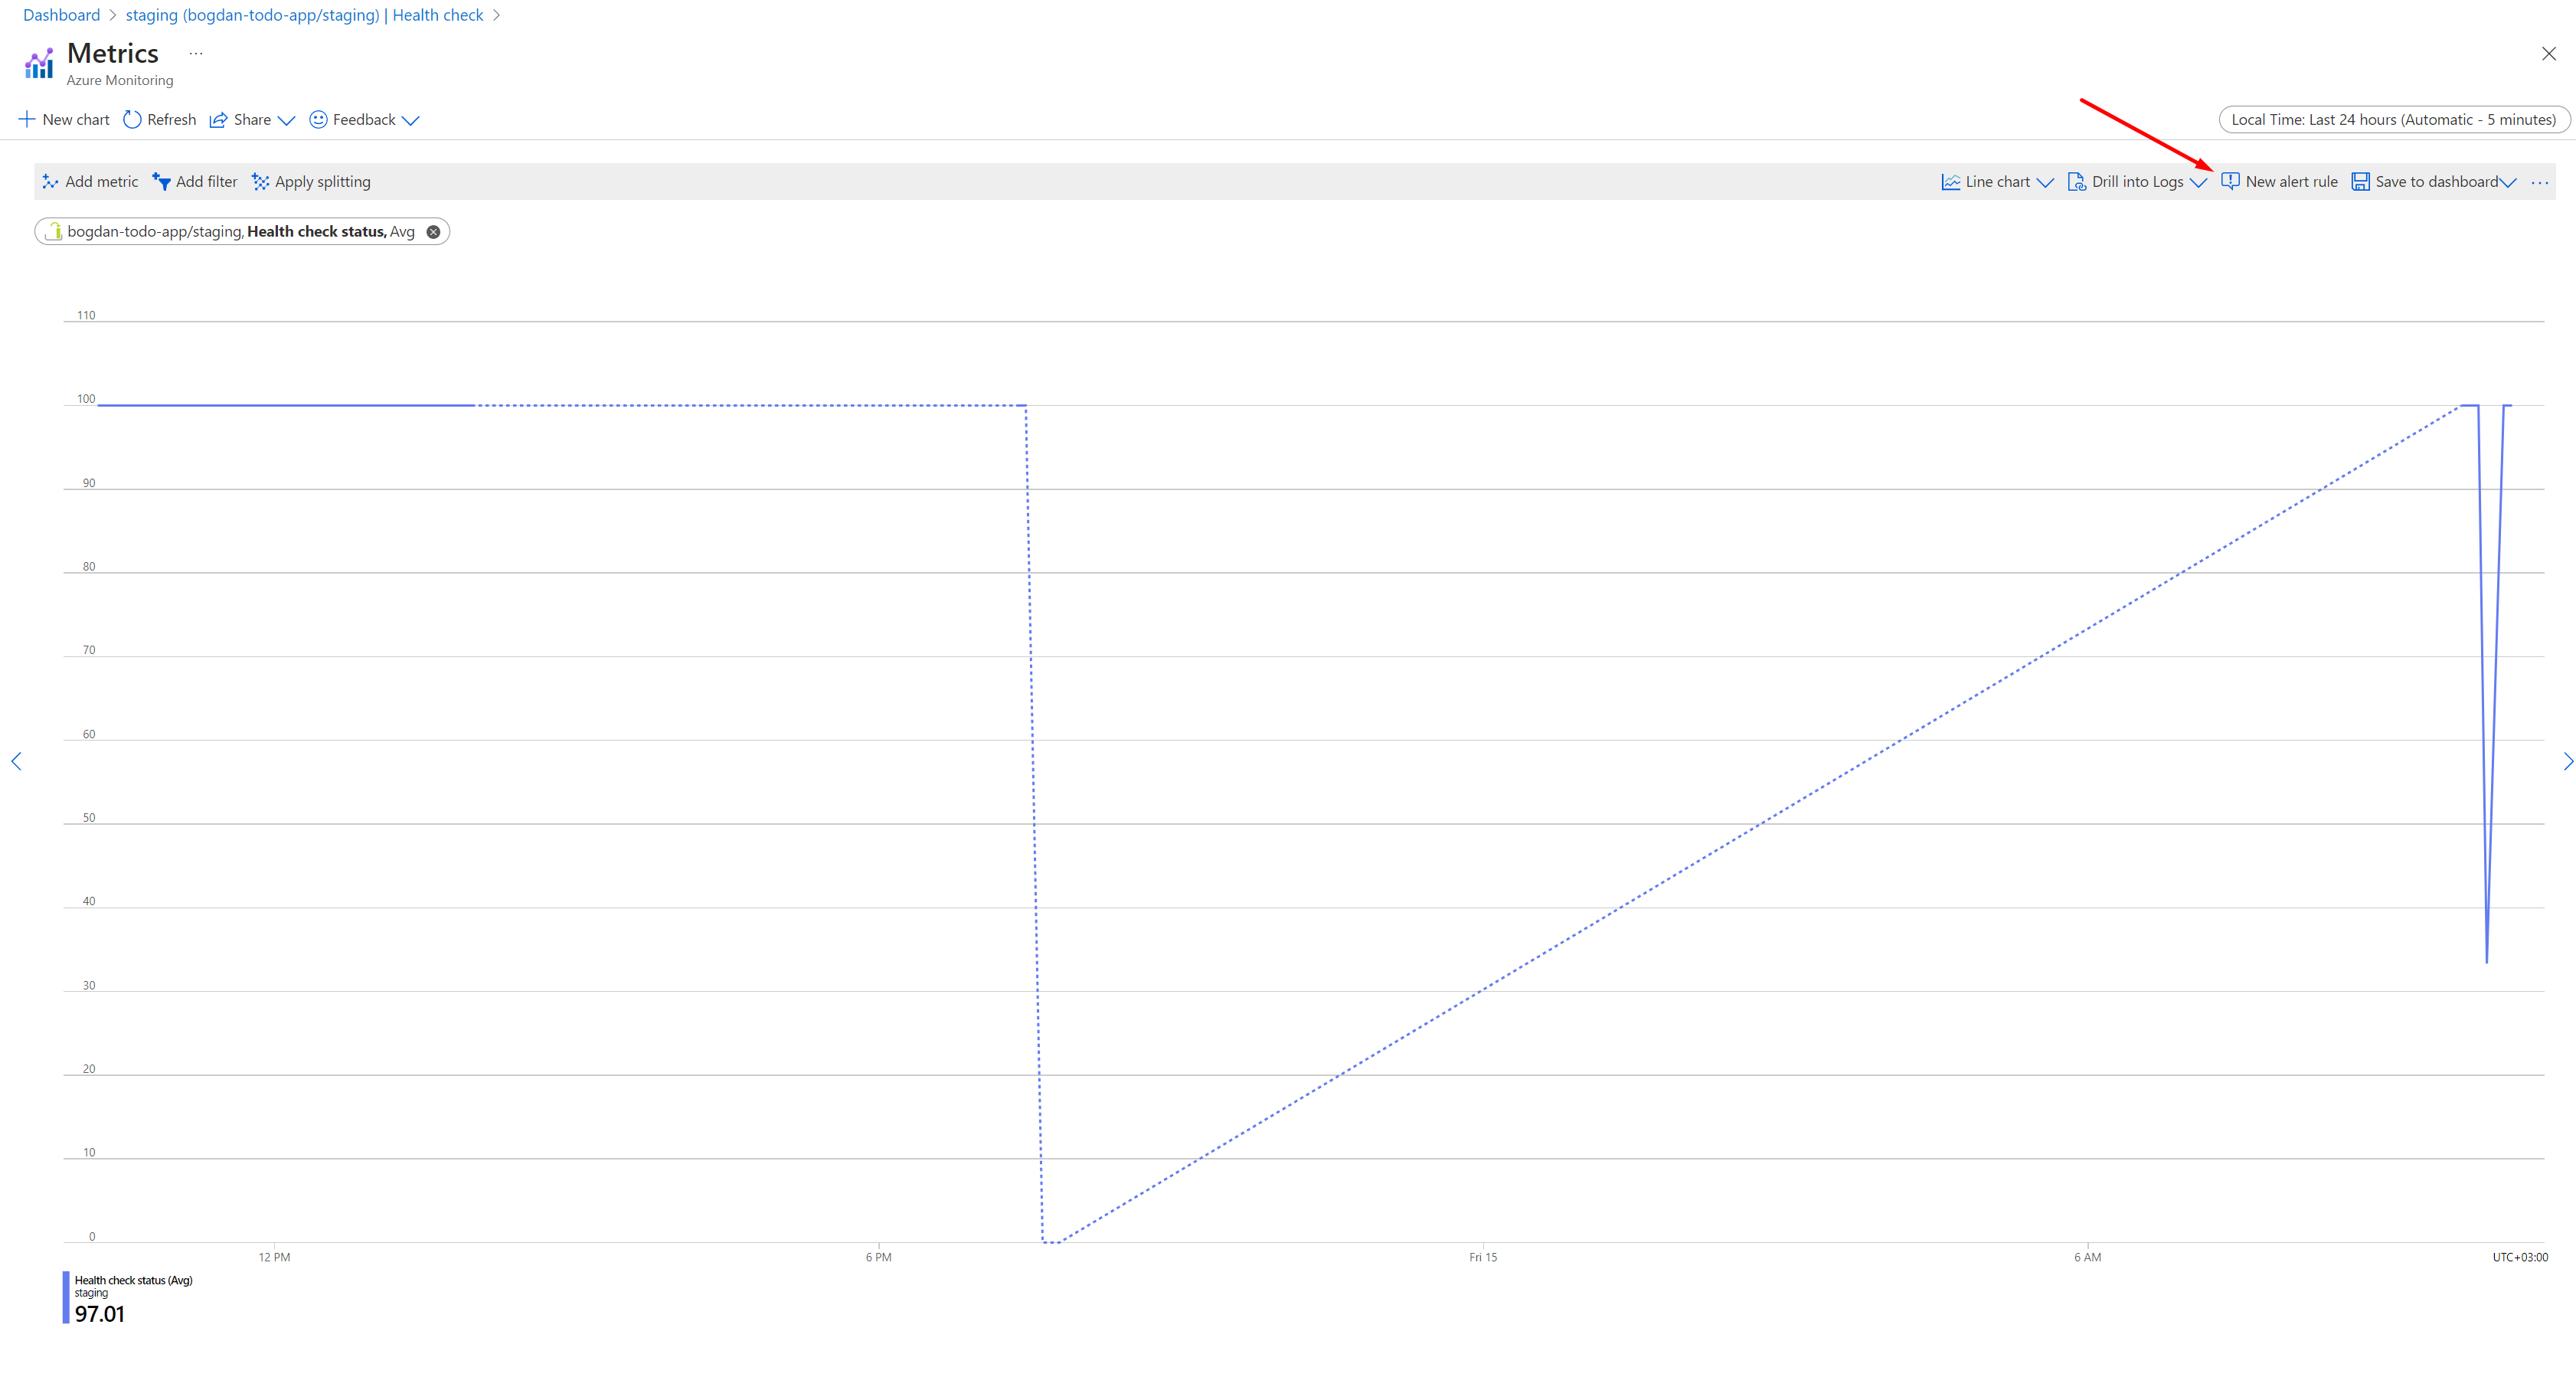
To define an alert you have to click on Metrics on the same screen, and then click on New alert rule
I won't delve into the details, as that could warrant a separate blog post, which I might consider writing later. For now, it's crucial to comprehend that by enabling health checks you can prevent issues from going into production or at least you can get notified when something bad happens.
Using predefined health checks
If you're using certain Azure services there are predefined health checks for them. For example, if you're using SQL Server with Entity Framework then you can install the package Microsoft.Extensions.Diagnostics.HealthChecks.EntityFrameworkCore and all you have to do is to add this line in your Program.cs
services.AddHealthChecks()
        .AddDbContextCheck<MyDbContext>();
This health check will test the connectivity and you can even pass a test query that will be executed.
There's a predefined health check for Azure Key Vault as well, you just need the Nuget package AspNetCore.HealthChecks.AzureKeyVault and here's how we use it:
services.AddHealthChecks()
         .AddAzureKeyVault(
              new Uri(configuration["KeyVaultUri"]),
              new DefaultAzureCredential(new DefaultAzureCredentialOptions()),
              setup => { setup.AddSecret("externalApiClientSecret"); });
The AddAzureKeyVault method accepts an action that allows interaction with the Key Vault. In our case, we not only test the connection to the Key Vault but also verify if our API can add a secret. If someone accesses the Key Vault and revokes the permission to create secrets, our health check will alert us to this issue. Pretty cool, right?
Best Practices for Health Checks
Broad Coverage: Health checks should be comprehensive. It's not just about the application being up, but whether all its dependencies (like databases, external services) are responsive.
Speed Matters: Health checks should be quick. Lengthy checks can delay deployments and might lead to timeouts.
Isolation: Ensure health checks don't affect the system's state. They should be idempotent.
Detailed Reporting: While a simple 'Healthy' or 'Unhealthy' might be okay for basic checks, having detailed reports can be invaluable during failures to trace back the issue.
Regular Monitoring: Instead of only using them during deployments, integrate health checks into monitoring tools for continuous feedback.
Wrapping Up
I think we can agree that health checks play a vital role in ensuring our applications are not only up but functioning correctly. By integrating these checks into our pipeline, we get an extra layer of validation before the swap, leading to more robust deployments.
The code for this app can be found here: https://dev.azure.com/bujdea/_git/AzureDevopsYamlPipeline
In the next article, we will add another layer of complexity and robustness by introducing another environment using Bicep. There, we'll focus on running end-to-end tests on this new environment while keeping our production environment's checks concise and efficient. Stay tuned and keep deploying with confidence!